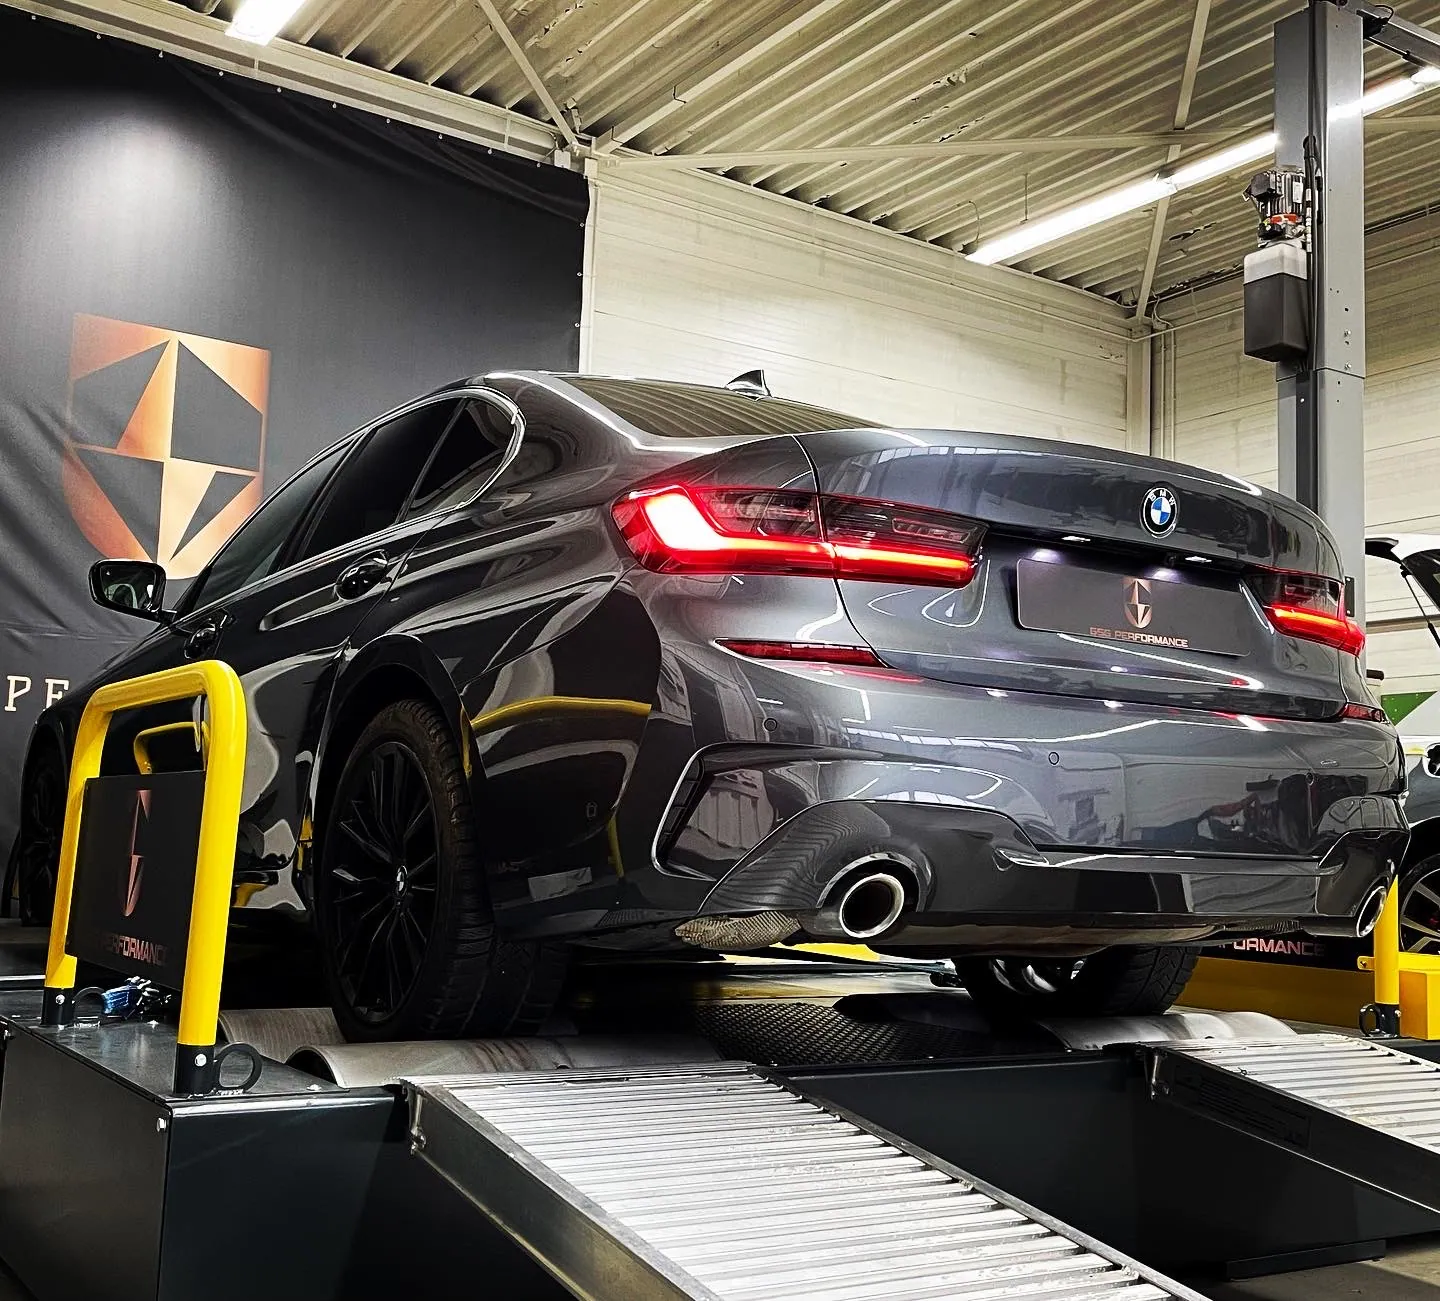
Zo werkt een sessie op onze vermogenstestbank
Gepubliceerd
Een vermogenstestbank, ook wel rollenbank of dyno, is de reden dat chiptuning bij ons geen kwestie is van "file laden en klaar". Op de bank meten we wat de motor werkelijk doet, in plaats van te vertrouwen op wat een tabel belooft. Zo ziet een sessie bij ons eruit, van binnenrijden tot meetblad.
Stap 1: intake en gezondheidscheck
Voordat de auto de bank op gaat, lezen we de foutcodes uit en kijken we naar de live-data: laaddruk in rust en onder last, brandstofdruk, de temperatuur van inlaatlucht en koelvloeistof, en bij diesels de belading van het roetfilter. We kijken ook naar de banden en de bandenspanning, want die zitten straks letterlijk tussen de motor en de meting in.
Vinden we iets afwijkends, dan bespreken we dat eerst. Tuning op een motor met een lek in het inlaattraject of een verstopt roetfilter heeft geen zin; de meting zou ons alleen maar het probleem laten zien, niet de winst.
Stap 2: de nulmeting
De auto wordt vastgezet op de rollen, we sluiten de koeling aan en meten de standaardauto. Deze nulmeting is belangrijk om twee redenen. Ze laat zien of de fabrieksopgave klopt (dat is verrassend vaak niet zo, in beide richtingen) en ze is de eerlijke referentie voor het resultaat na de tuning. Zonder nulmeting is elke "plus 40 pk" een gok.
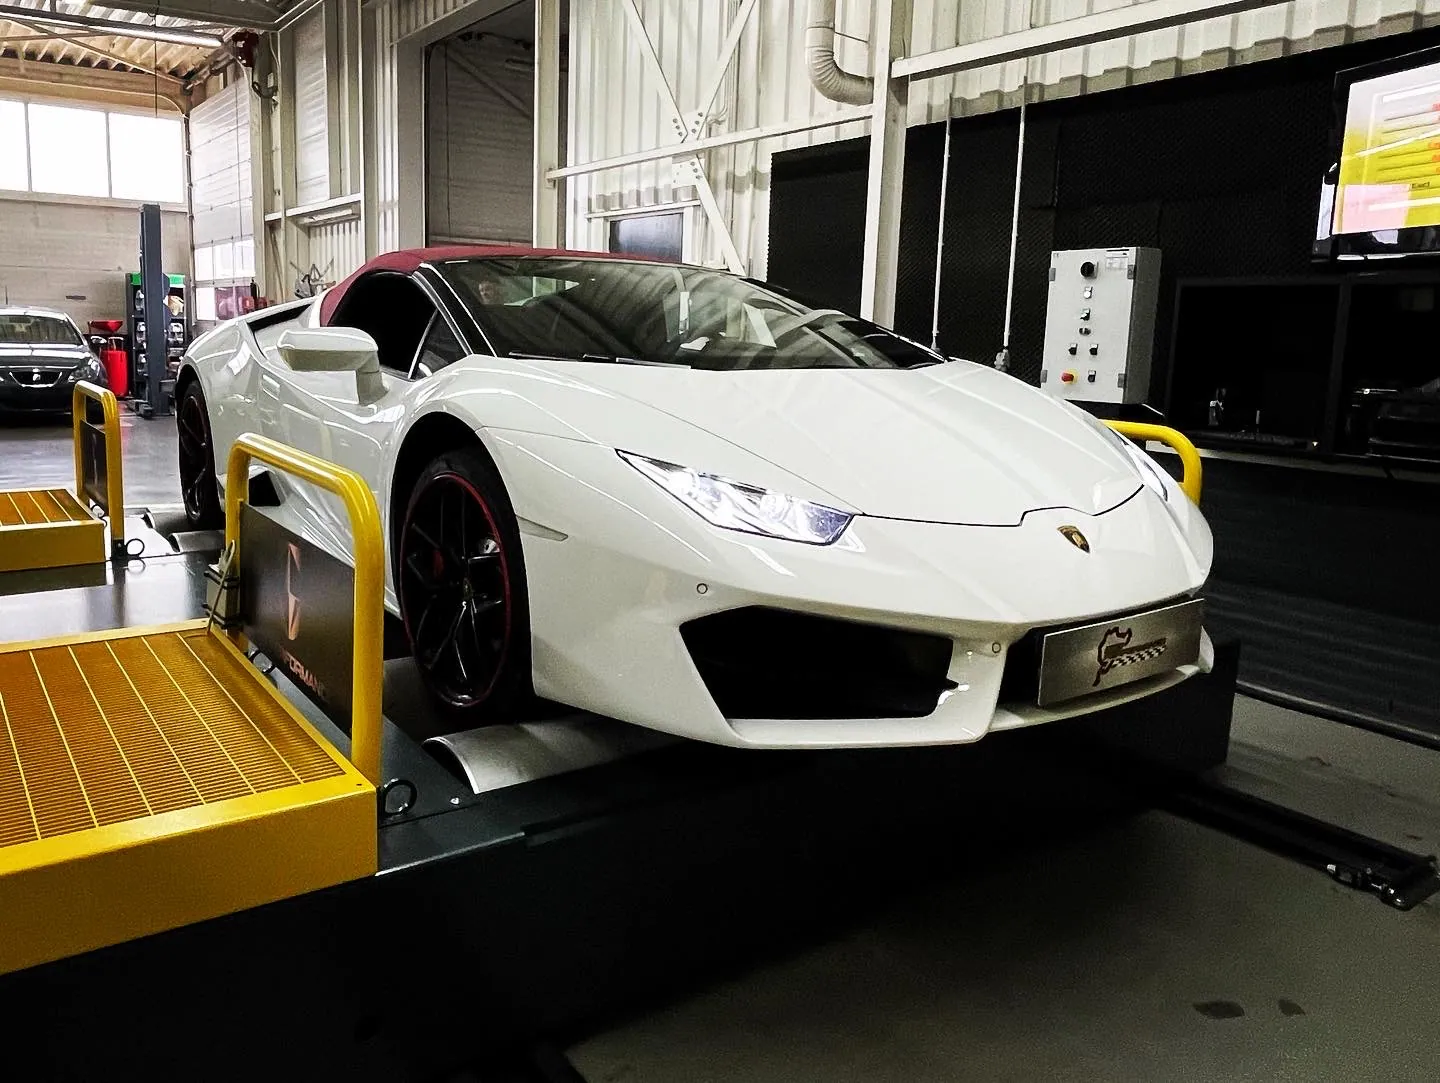
Stap 3: kalibreren, meten, bijstellen
Nu wordt de software aangepast. We verhogen de laaddruk in stappen, passen inspuiting en timing aan en meten opnieuw. Tijdens elke run loggen we:
- laaddruk, gevraagd en werkelijk, over het hele toerenbereik;
- uitlaatgastemperatuur, de belangrijkste bewaker bij diesels;
- inlaattemperatuur na de intercooler, de bewaker bij benzine;
- lambda (mengselverhouding) en bij benzinemotoren de klopregeling;
- de koppelaanvraag van de versnellingsbak bij automaten.
Zien we dat de motor ergens tegen een grens loopt, bijvoorbeeld een turbo die buiten zijn efficiënte gebied komt, dan is dat het punt waar we stoppen. Niet het punt waar het grafiekje het mooist is.
Deze stap is het verschil tussen een generieke tuning en een afstelling op maat. Twee auto's van hetzelfde type hebben zelden exact dezelfde optimale instelling: brandstof, slijtage van de turbo, een ander luchtfilter of gewoon productiespreiding maken het verschil.
Stap 4: de eindmeting en de grafiek
De laatste run levert de grafiek op die je meekrijgt: vermogen en koppel uitgezet tegen het toerental, voor en na. Probeer het zelf, liefst met je eigen auto: vul je kenteken in of zoek je uitvoering op, start meting 1 op de originele software, daarna Stage 1 en GSG+, en kijk hoe de curves over elkaar vallen. Of druk op Alles afspelen.
Interactief · Bapro BPA 4R
Meet zelf: jouw auto op onze Bapro
| Meting | Max. vermogen | Max. koppel | Correctie |
|---|---|---|---|
| Origineel · voorbeeld: 2.0 turbobenzine | – | – | – |
| Stage 1 · voorbeeld: 2.0 turbobenzine | – | – | – |
| GSG+ · voorbeeld: 2.0 turbobenzine | – | – | – |
Zo lees je het meetblad dat je meekrijgt:
- De koppelcurve moet breed en vlak zijn, niet een piek die snel wegzakt. Een breed plateau betekent dat de auto in elke versnelling trekt.
- Geen dips in de curve. Een dip wijst op een begrenzer die vecht met de nieuwe afstelling, of op een turbo die even geen adem heeft.
- Het maximale vermogen is minder belangrijk dan het gebied tussen grofweg 1800 en 4000 toeren. Daar rijd je dagelijks; daar moet de winst zitten.
- Vergelijk alleen metingen van dezelfde bank op dezelfde dag. Luchttemperatuur, luchtdruk en bandenspanning beïnvloeden elke meting. Daarom meten wij voor en na in één sessie.
Pas op met folders en fora. Een "plus 60 pk" zonder nulmeting op dezelfde bank zegt niets. Vraag altijd om het meetblad van voor én na, gemeten op dezelfde dag.
Stap 5: testrit met datalog
Een rollenbank is gecontroleerd, de weg niet. Wind, helling, een volle auto en een warme dag zijn omstandigheden die de bank niet nabootst. Daarom sluiten we af met een testrit waarbij we dezelfde waarden loggen als op de bank. Klopt alles onder echte rijomstandigheden, dan is de auto klaar. Je krijgt de meetbladen en de curves mee.
Waarom wij dit zo doen
Het kan sneller. Een file laden via de diagnosepoort duurt twintig minuten en levert op papier hetzelfde getal op. Het verschil zit in wat je niet ziet: de uitlaatgastemperatuur die net te hoog blijft, de klopregeling die af en toe ingrijpt, de automaat die zijn koppellimiet bereikt. Dat zijn de dingen die na een jaar een reparatie worden. Op de bank zien we ze meteen.
Benieuwd wat jouw auto op de bank doet? Kijk bij chiptuning wat we voor jouw uitvoering verwachten, of plan een sessie.